
Our Blog
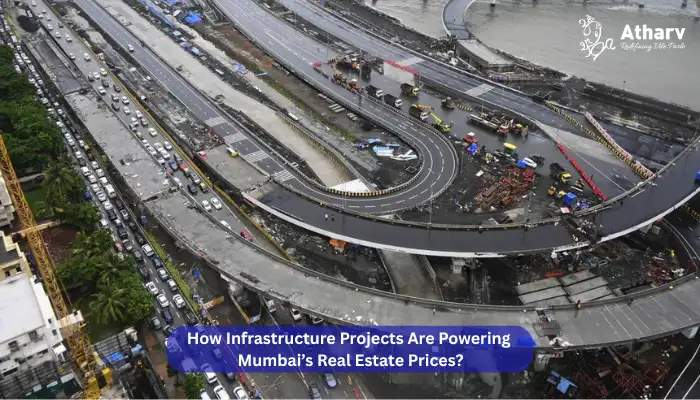
How Infrastructure Projects Are Powering Mumbai’s Real Estate Prices?
-
 By Atharvlifestyle
 -
 February 18, 2026
 -
 Uncategorized
Mumbai’s real estate story has always been infrastructure-led. Every major leap in connectivity — suburban rail, express highways, sea links, and now multi-line metro corridors — has reshaped demand patterns and triggered price appreciation.
In 2025–2026, this trend has accelerated. Mega projects across South Mumbai, Western Suburbs, Navi Mumbai, Thane, and extended MMR are not just reducing commute times — they are actively redefining property values.
1. Mumbai Trans Harbour Link (Atal Setu): Navi Mumbai’s Growth Engine
The 21.8 km sea bridge connecting Sewri to Chirle has transformed Navi Mumbai’s accessibility to South Mumbai.
Property Price Impact (2025–2026)
In the MTHL influence zone, prices have surged by up to 23%, with another 10–15% appreciation expected.
Key micro-markets:
- Ulwe
From ₹6,000–7,500/sq ft (pre-MTHL) to ₹7,500–10,000/sq ft.
Many 2 BHK units now cross ₹1 crore. - Panvel
From ₹5,000–8,000/sq ft to ₹6,500–10,000/sq ft — emerging as a strong affordable hub. - Kharghar
₹14,000–18,000/sq ft in high-demand pockets. - Dronagiri
₹6,000–7,000/sq ft, up from ₹4,500–5,500/sq ft.
Why Prices Are Rising
- Faster access to South Mumbai.
- Improved connectivity to highways.
- Synergy with the upcoming Navi Mumbai International Airport.
- Strong investor confidence in long-term urban planning.
Navi Mumbai is increasingly viewed as an extension of Mumbai’s core rather than a distant satellite.
2. Mumbai Metro Line 3 (Aqua Line): Premium Within 1 km
The underground Colaba–Bandra–SEEPZ corridor has significantly impacted pricing across Central and South Mumbai.
Appreciation Trends
Properties within a 1 km radius of stations have witnessed 10–40% appreciation, depending on supply constraints and location.
Regional Price Highlights
- South Mumbai (Colaba, Cuffe Parade, Churchgate)
₹60,000 to ₹1,00,000+ per sq ft. - Worli & Lower Parel
₹55,000–85,000 per sq ft near stations. - Bandra West & Khar
₹45,000–65,000 per sq ft due to airport and BKC connectivity. - Marol / SEEPZ
₹16,500–22,000 per sq ft; 25–30% appreciation.
Market Drivers
- Seamless connectivity between Nariman Point, BKC, airport, and SEEPZ.
- Strong rental demand (3–4% yields).
- Reduced travel stress for professionals.
3. Mumbai Metro Line 1: The Proven East–West Multiplier
Since 2014, the Versova–Andheri–Ghatkopar corridor has shown how metro connectivity drives capital growth.
Impact on Property Prices
- 10–15% increase within 18 months of operations.
- 10–20% premium for properties within 500m–1 km of stations.
- 12–14% annual appreciation in prime pockets.
Key Beneficiaries
- Andheri West (~₹27,500 per sq ft).
- Andheri East (strong commercial growth).
- Ghatkopar West (redevelopment momentum).
This line triggered higher-density projects, premium redevelopment, and stronger rental absorption — a pattern now repeating across new corridors.
4. Thane & Northern Corridors: The Spillover Effect
Infrastructure-led growth is no longer limited to South or Central Mumbai. Northern and peripheral markets are absorbing demand spillover.
Key Projects Influencing These Markets
- Thane–Borivali Twin Tunnel
- Goregaon–Mulund Link Road
- Mumbai Metro Line 4
- Mumbai Metro Line 5
- Mumbai Metro Line 9
Price Impact
- Thane premium pockets: 8–15% steady annual growth.
- Mira Road & Bhayandar gaining traction.
- Bhiwandi emerging as a residential-logistics hybrid hub.
5. Coastal Roads & Sea Links: Premiumisation of Western Mumbai
- Mumbai Coastal Road Project
- Bandra–Worli Sea Link
- Versova–Bandra Sea Link
These projects are reducing signal congestion and enhancing east–west mobility, pushing demand for luxury housing in Bandra, Worli, and adjoining areas.
6. Airport & Rail Expansion: Long-Term Catalysts
- Chhatrapati Shivaji Maharaj International Airport upgrades.
- Panvel–Karjat Suburban Rail Corridor.
- Mumbai Metro Line 8.
Air connectivity creates commercial expansion, hospitality growth, and executive housing demand — driving sustained appreciation.
The Pattern Is Clear: Infrastructure = Price Multiplier
| Typical Price Impact | Stock Market Investment |
| Metro within 1 km | 10–30% premium |
| Major sea link/bridge | 15–25% corridor appreciation |
| Airport influence zone | 20%+ long-term upside |
| East–West connectors | 8–15% sustained growth |
Mumbai’s growth is no longer radial from South Mumbai — it is network-driven.
Infrastructure reduces travel time, improves accessibility, and increases commercial and retail activity. This raises end-user demand, enhances rental potential, and boosts developer interest — ultimately increasing willingness-to-pay and property valuations.
• Under-construction corridors may offer higher upside but involve timing and execution risk.
• Completed infrastructure zones provide more stable pricing, faster liquidity, and lower uncertainty — though upside may be relatively moderate.
Your choice depends on risk appetite and investment horizon.
Markets within 500m–1 km of metro stations consistently outperform surrounding areas in both price growth and absorption.
Conclusion
Infrastructure is no longer a background factor in Mumbai real estate — it is the primary price driver.
Whether it’s metro corridors, sea links, tunnels, or airports, connectivity is shaping demand patterns and unlocking new value corridors across MMR.
In Mumbai today, infrastructure doesn’t just support growth — it creates it.
With Atharv Lifestyle, you can explore strategically located homes and investment opportunities designed to benefit from Mumbai’s rapidly evolving infrastructure landscape. Connect with Atharv Lifestyle to discover your future-ready property today.